Goals and Background
The objective of this lab is to learn how to perform photogrammetric tasks on satellite image and aerial photographs. The beginning portion of the lab is designed to help me understand the mathematics behind the calculations which take place in photogrammetric tasks. The later portion of the lab will give me and introduction to stereoscopy and performing orthorectification on satellite images. The completion of this lab will give me the basic tools and knowledge to perform multiple photogrammetric tasks.
Methods
Scales, Measurements, and Relief Displacement
The first portion of this lab I will be completing multiple measurements and calculations on aerial photographs. I will be utilizing Erdas Imagine for one of the calculations and manual calculating the other measurements.
Calculating Scale of Nearly Vertical Aerial Photographs
The ability to calculate the scale of a aerial photograph is an essential which everyone in the remote sensing field must have the ability to do. Calculating the scale can be done in a couple different manners.
One of the ways to complete this calculation is to take a measurement of two points on your aerial photograph and compare that measurement to the real world distance. Though this is a great and simple method it isn't always possible to obtain a measurement in the real world. I will discuss the method to be used when real world measurements are not possible a little later.
Utilizing an image and labeled by my professor I measured from point A to point B with my ruler and got a measurement of 2.7 inches. (Fig. 1). I was give the dimension in the real world from point A to point B was 8822.47 ft. My next step I converted the real world dimension to inches which was 105869.64. This left me with a fraction of 2.7/105869.64. The last calculation was to divide the numerator and the denominator by 2.7 which gave me an answer of 1/39210. I was instructed to round to the nearest thousand for my answer. The scale of this aerial image is 1/40,000.
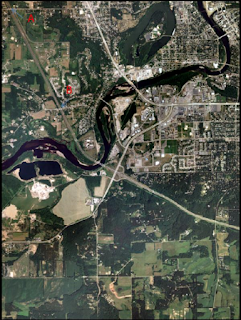 |
| (Fig. 1) Image with label points to calculate measurements from (Not calculated at the scale the image is displayed) |
Photographic scale can be calculated without a true real world measurement as long as you know the focal length of the camera and the flying height above the terrain of the aircraft which took the image. We were given all of the information need to calculate the scale of a different image (Fig. 2) from our professor. The information I was given was as follows: Aircraft altitude= 20,000 ft, Focal length of camera=152 mm, and the elevation of the area in the photograph=769 ft.
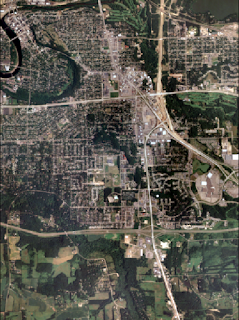 |
| (Fig. 2) Image I calculated scale for utilizing the camera and altitude dimensions. |
The first step was to convert all of the data information in to the same
measurements. To reduce the risk of conversion errors I decided to
convert the focal length which was the only measurement that wasn't in
feet. Converting 152 mm to feet gave me a dimension of .4986816 ft.
Using the formula Scale= f/H-h with the dimensions showing the the image below (Fig. 3). you are able to calculate the scale of the image. Using the formula I input the numbers I was given: .4986816/(20000-796). Completing the math in the denominator gave me a fraction of .4986816/19204. Dividing the numerator and denominator by .4986816 gave me a fraction of 1/38509. Rounding the denominator to the nearest even thousand gave me a fraction representing the scale of the image of 1/40,000.
 |
| (Fig 3.) Detailed description and display of measurements required to calculate image scale. |
Measurement of areas of features on aerial photographs
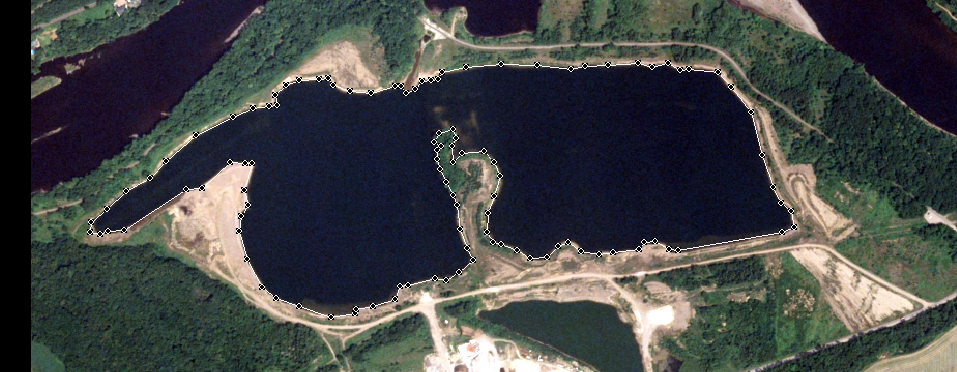
For this section of the assignment I will be utilizing Erdas Imagine to calculate the area of a lagoon in an aerial image (Fig. 4) given to me by my professor.
Utilizing the polygon measurement tool in the measure tool bar (Fig. 4) I traced the outline of the lagoon to be able to calculate the perimeter and area (Fig. 5).
 |
| (Fig. 4) Measure tool bar with the polygon tool selected. |
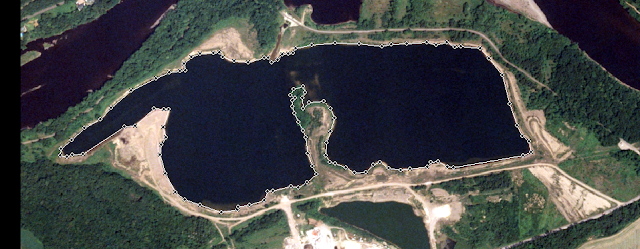 |
| (Fig. 5) Outline using the measurement tool in Erdas Imagine. |
Once the polygon has been completed the measurement are displayed in the
Measurements window (Fig. 6). Utilizing the tool bar at the top you can alter the measurements to into multiple varieties such and inches, feet, meters (Perimeter) and acres, square feet, or square meters just to name a few.
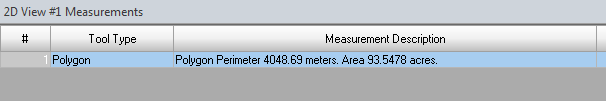 |
| (Fig. 6) Perimeter and Area displayed in the Measurement window. |
Calculating relief displacement from object height
Relief displacement is the variation of objects and features within an aerial image from their true planimetric position on the ground. Looking at (Fig. 6) you will see a smoke stack label "A". You can see the smoke stack is at an angle. In the real world if you were standing next to the stack it would be perfectly vertical and not leaning or at an angle. This "displacement" related to the location of the
Principal Point (center of the image when it was taken) and the location of the feature. The scale of the image is 1:3209 and the camera height is 3,980 ft.
To calculate the relief displacement (d) you must know the height of the object in the real world (h), radial distance from the principal point to the top of the displaced object (r), and the height of the camera when the image was taken (H). To calculate the displacement you use the formula (D)isplacement= h*r/H.
To complete the forumla I needed to obtain 2 different variables which were not provided for me. I need to calculate the heights of the smoke stack using the scale and I needed to measure the distance from the principal point to the top of the smoke stack. Using the scale and a ruler I determined the height of the smoke stack was 1604.5 inches and the radial distance from the principal point was 10.5 inches. I converted the camera height to feet which gave me 47760 inches. Inputting these variables into the formula gave me the displacement of .352748 inches. To correct this image the smoke stack would have to be pushed back the .352748 inches to make vertical.
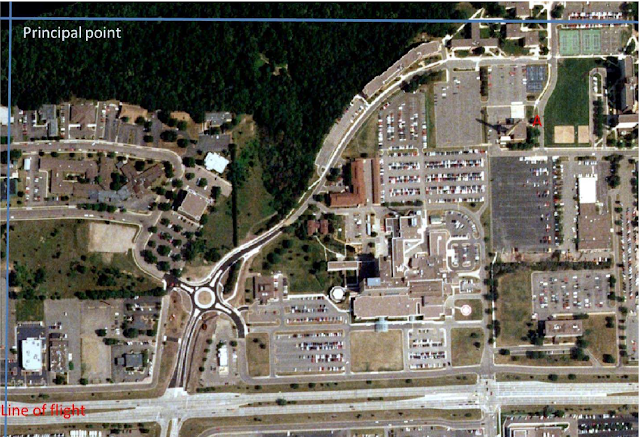 |
| (Fig. 6) Image to calculate relief displacement from. |
Stereoscopy
Stereoscopy is the science of dpeth perception utilizing your eyes or other tools to view a 2 dimensional (2D) image in 3 dimensions (3D). You can use multiple tools such as a
Stereoscope,
Anaglyph and Polaroid glasses, or through development of a stereomodel to view 2D images in 3D.
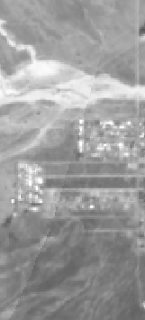
In this lab we will be utilizing Erdas Imagine to create an Anaglyph. To create the Anaglyph we will be using Anaglyph tool with in the Terrain menu tab. I imported an aerial image and a Digital Elevation Model (DEM) (Fig. 7) of the same area into the Anaglyph Generation menu. Then next step is to run the tool, and after it is complete you can open up the Anaglyph image in Erdas. Once open in Erdas or any other image viewing tool you can use Polaroid glasses (3D glasses) to view the image in 3D (Fig. 8).
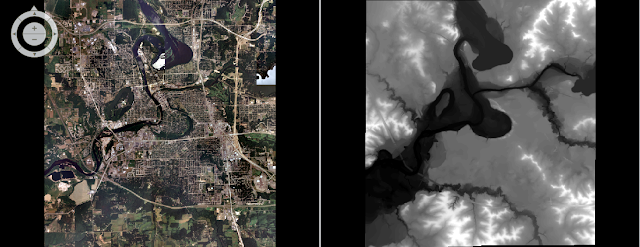 |
| (Fig. 7) Aerial image (left) and DEM (right) used to create Anaglyph in Erdas Imagine. |
 |
| (Fig. 8) Anaglyph image produced in Erdas Image, if you use Polaroid glasses you will be able to see the image in 3D. |
Orthorectification
Orthorectification refers to simultaneously removes positional and elevation errors from one or multiple aerial photographs or satellite images. This process requires the analyst to obtain real world x,y, and z coordinates of pixels on aerial images and photographs. Orthorectified images can be utilized to create many products such as DEM's, and Stereopairs.
For this section of the lab I will be using Erdas Imagine Lecia Photogrammetric Suite (LPS). This tool with in Erdas Imagine is used for triangulation, orthorectification with digital photogrammetry collected by varying sensors. Additionally, it can be used to extract digital surface and elevation models. I will be using a modified version of Erdas Imagine LPS user guide to orthorectify images and in the process create a planimetrically true orthoimage.
I was provide two images which needed orthorectification. The images overlapped a specific area but but were not exactly the same. When you brough them into Erdas they layed perfectly on top of one another. For this reason I knew the images needs to be corrected.
The first step was to create a
New Block File in the
Imagine Photogrammetry Project Manager window. In the
Model Setup dialog window I set the
Geometric Model Category to
Plynomial-based Pushbroom and selected
SPOT Pushbroom in the second section window. In the
Block Property Setup I set the projection to
UTM, the
Spheroid Name to
Clarke 1866, and the
Datum to
NAD 27 (CONUS). I then brought in the first image and verified the the parameters of the SPOT pushbroom sensor in the
Show and Edit Frame Properties menu.
The next step I activated the point measurement tool and started to collect GCP's. I set the point measurement tool to
Classic Point Measurement Tool. Using the
Reset Horizontal Reference icon I set the
GCP Reference Source to
Image Layer. I was then prompted to import the reference image, and checked the
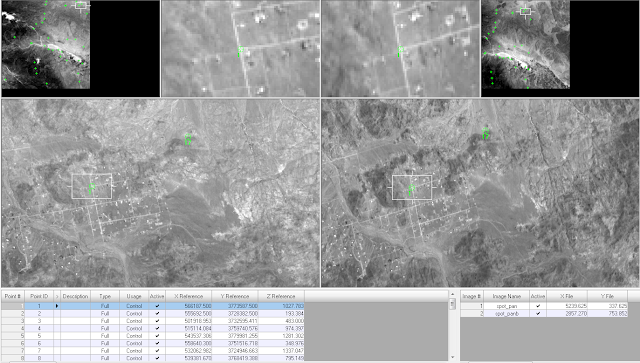
Use Viewer AS Reference box. Now I had one of the images which needed to be corrected in the viewer with a reference image which had been previously corrected (Fig. 9). I was given the location for the GCP from my professor. I proceeded to locate 9 GCP's on the uncorrected image and the reference image. Utilizing the same method I collected 2 other GCP's from an alternate image.
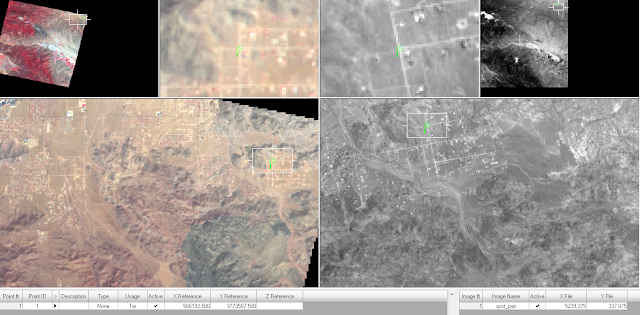 |
| (Fig. 9) Collecting GCP's with the reference image (left) and the uncorrected image (right). |
The next step was to set the Vertical Reference Source and collect elecation information utilizing a DEM. Clicking on the Reset Vertical Reference Source icon opens a menu to set the Vertical Reference Source to a selected DEM. After selecting the DEM in the menu I selected all of the values in the cell array and clicked
Update Z Values on Selected Points icon. This set the Z (elevation values) to the GCP points I had previously set.
After all of the GCP's were added and the elevation was set to the first image I needed to import the second image for correction. To properly complete this step I had to set the Type and Usage for each of the control points. I changed the
Type to
Full and the
Usage to
Control for each of the GCP's.
Now I was able to use the
Add Frame icon and add the second image for orthorectification. I set the parameters and verified the SPOT Sensor specifications the same as the first image. With both images brought into the viewer I was able to click on one of the GCP's from the list and then add a GCP to the second image to reference the locations between the 2 images (Fig. 10). I correlated GCP's for points 1,2,5,6,8,9,and 12 (technically 11).
 |
| (Fig. 10) Original GCP selected (blue highlighted lower left) and selected corresponding area in second image for correction. |
Next I used the
Automatic Tie Point Generation Properties icon to calculate tie points between the two images. Tie points are points which have an unknown ground coordinates but are able to be visually identified in the overlap area of images. The coordinates of the tie points are calculated during a process called block triangulation. Block triangulation requires a minimum of 9 tie points to process.
In the
Automatic Tie Point Generation Properties window I set the
Image used to
All Available and the
Initial Type to
Exterior/Header/GCP. Under the distribution tab I set the
Intended Number of Points/Images to 40. After running the tool I was able to inspect the
Auto Tie Summary to inspect the accuracy. The accuracy was good for the points I inspected so I made not changes.
Next I ran the
Triangulation tool after setting the parameters as follows.
Iterations wtih Relaxation was set to a value of 3,
Image Coordinate Units for Report was set to
Pixels. Under the
Point tab I set the type to
Same as Weighted Values and the X,Y, and Z values to 15 to assure the GCP's are accurate with in 15 meters. After running the tool a report was displayed to asses the accuracy (Fig. 11). In the report our able to examine a number of parameters including the RMSE.
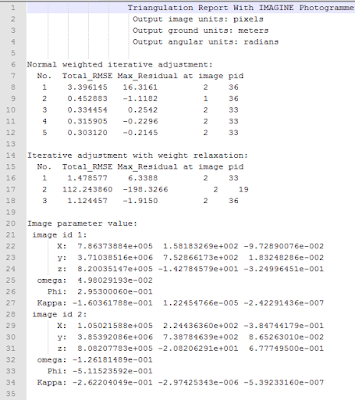 |
| (Fig. 11) Triangulation Report from Erdas Imagine. |
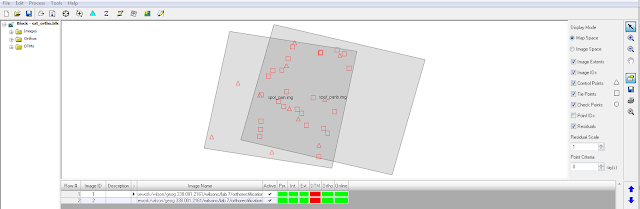 |
| (Fig. 12) Project Manager window display after triangulation was completed. This shows how the images are overlapped. |
The final step of this lab was to run the Ortho Resampling Process. Making sure I had the first image selected in the project management screen, I used the DEM I used previously, and set the
Resampling Method to
Bilinear Interpolation under the
Advanced tab. Next I added the second image through the
Add Single Output window. Once the tool was ran I had completed the task of Orthorectification of these two images.
Results
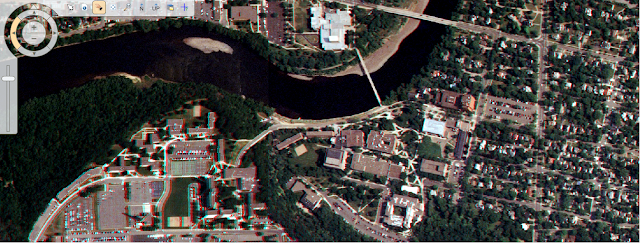
The final results of my Orthorectification resulted in accurately positioned images (Fig. 13). When zoomed in you can not tell beside the color variation where one picture ends and the other one begins (Fig. 14).
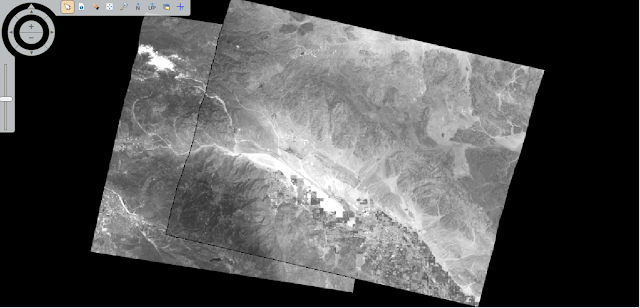 |
| (Fig. 13) Final product of the two images after Orthorectification. |
 |
| (Fig. 14) Zoomed in image along the transition from one image to the next. |
Data Sources
National Agriculture Imagery Program (NAIP) images are from United States Department of
Agriculture, 2005.
Digital Elevation Model (DEM) for Eau Claire, WI is from United States Department of
Agriculture Natural Resources Conservation Service, 2010.
Spot satellite images are from Erdas Imagine, 2009.
Digital elevation model (DEM) for Palm Spring, CA is from Erdas Imagine, 2009.
National Aerial Photography Program (NAPP) 2 meter images are from Erdas Imagine, 2009.


